Research theme 02
Photoinduced band renormalization in a dielectric: from band-gap narrowing to loss of cohesion
Scale: Å · as to ps · order parameter: band occupation and bonding charge
A wide bandgap solid is, at equilibrium, the simplest possible electronic system: a filled valence band, an empty conduction band, nine electronvolts between them. A femtosecond pulse destroys that arrangement in a few optical cycles. What replaces it has its own gap, its own pressure and its own optical response, and none of these can be looked up. This theme computes them, and they are the entry point of every model further down the chain.
First-principles description of the photoexcited state of silica. With Arshak A. Tsaturyan, Elena Kachan and Razvan Stoian.
The method is to impose the nonequilibrium occupation explicitly, through a Fermi-Dirac distribution at an elevated electron temperature, keep the ions where they are, and recompute the electronic structure self-consistently. Every quantity that follows is then a function of a single control parameter, the degree of excitation.
The first thing that moves is the gap. Redistributing the electron density changes the atomic charges of silicon and oxygen from 1.26 and -0.71 to 0.90 and -0.51 at an electron temperature of 2.8 eV, while the silicon-oxygen distance grows by about seven percent. Together these two effects cut the electrostatic attraction between the two species roughly in half, and above that threshold the network loses its cohesion.
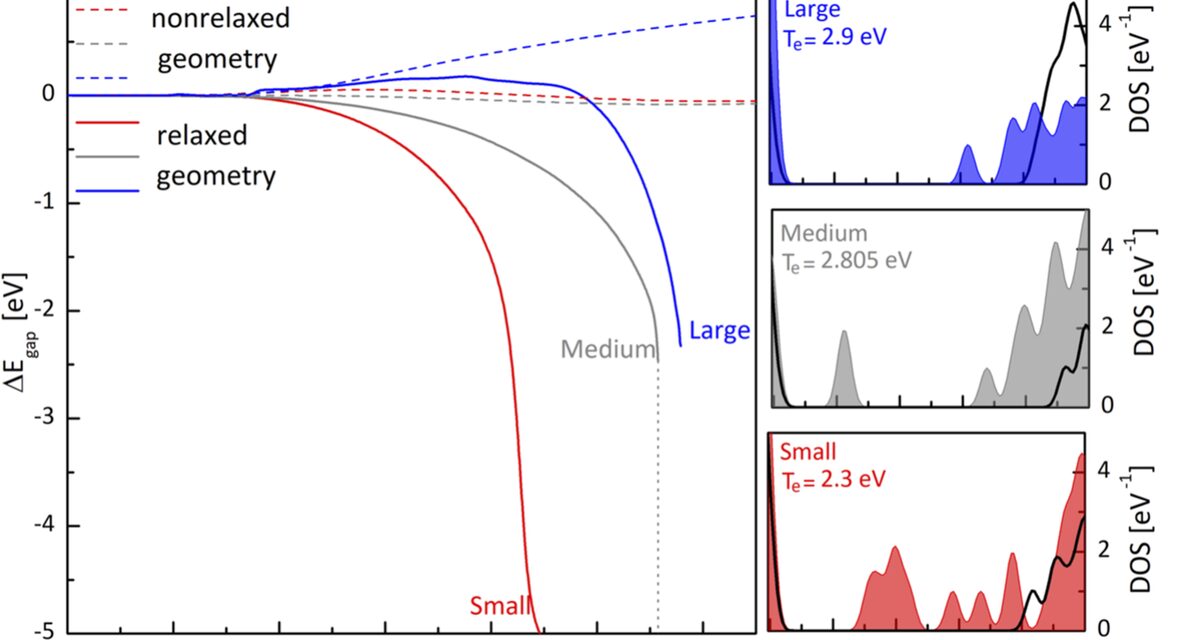
Separating the two contributions matters because only one of them is available within the pulse. Bond softening and atomic motion along unconventional trajectories can occur within about ten femtoseconds at the sound velocity of the material, so part of the narrowing is already structural before electron-phonon equilibration. The amorphous state helps: with free volume everywhere and no long-range order to preserve, the network relaxes far more easily than quartz can.
An important subtlety is that the gap narrows without collapsing. The excited electrons delocalize in space, which changes the screening rather than destroying the bonding outright, so the material remains a dielectric with a reduced gap instead of turning metallic. That distinction is what keeps the absorption nonlinear, and therefore keeps the energy deposition localized, throughout the pulse.
The order that is destroyed here is the orbital one: which states are occupied, and how much charge sits on the bond between silicon and oxygen. Everything mechanical that follows is a consequence of that redistribution.
01What the excited electronic structure actually looks like
Fused silica has no crystal to lean on. It is a network of SiO4 tetrahedra with a broad distribution of angles, so the electronic structure has to be computed on a molecular cluster large enough to carry that disorder: here (SiO2)10, with the hybrid functional tuned until the ground-state gap matches the measured 9 eV. Excitation is then introduced not as a rigid shift but as a finite electron temperature: the Kohn–Sham states are given fractional Fermi–Dirac occupations and the calculation is made self-consistent again, so the electron redistribution and the band structure are solved together.
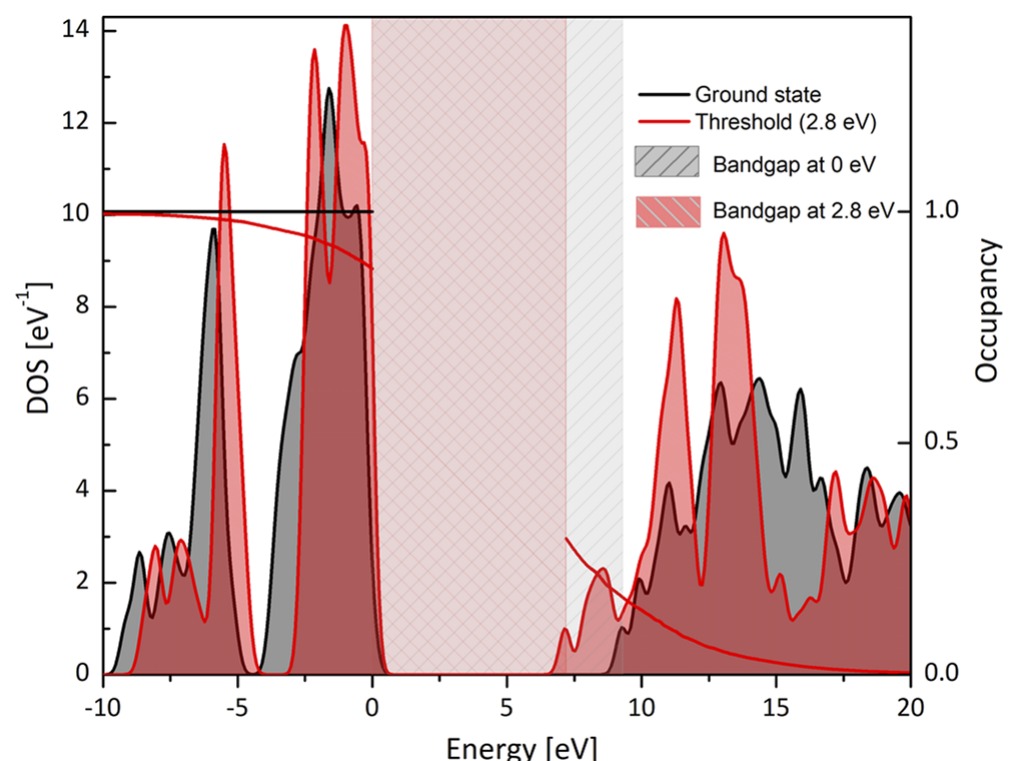
Electronic density of states and Fermi–Dirac occupancy at Te = 0 and at the stability threshold of 2.8 eV. The gap, shaded, narrows as empty states are filled and the exchange–correlation screening changes.
Two things happen at once. Thermally excited electrons populate states that were empty, and that filling changes the self-consistent solution itself: the screening increases, the Coulomb hole and exchange attraction weaken, and the gap narrows. The narrowing is not a small correction. It is the same screening effect known at high electron temperature in metals, and it drives the material into a genuinely nonequilibrium electronic state.
Note that the ground-state highest occupied orbital sits mainly on oxygen atoms, while the lowest unoccupied one has a significant contribution from silicon: excitation therefore moves charge from oxygen towards silicon, which is exactly what softens the bond.
Following the gap as a function of electron temperature, with the geometry re-optimized at each step, gives a curve that is smooth up to a threshold and then stops: above about 2.8 eV the system is no longer mechanically stable, bonds break, and no relaxed structure exists. Below that threshold the dependence is well described by a single exponential, which makes it directly usable in a mesoscale model.
The snapshots along the curve say something the number alone does not: the tetrahedral network expands as the gap closes. Average Si–O distances go from 1.62–1.65 Å in the ground state to 1.74–1.77 Å after relaxation at the threshold: a 20% volume expansion at constant mass, that is, a drop in density before any thermal effect.
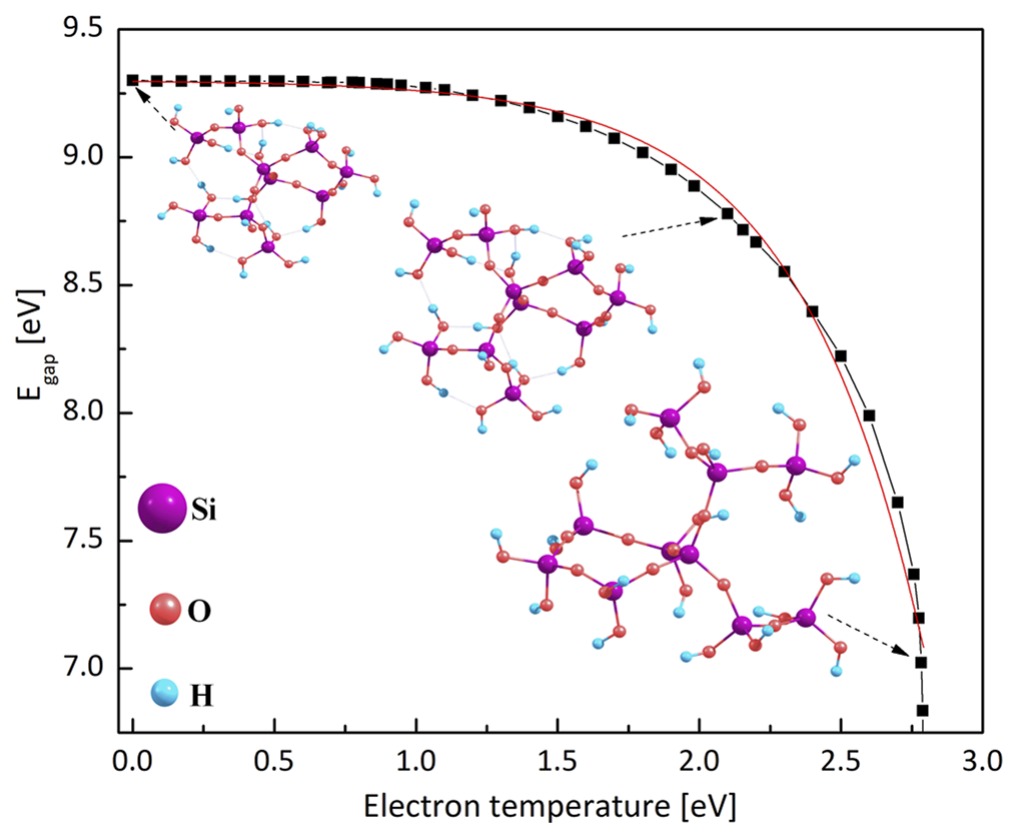
Bandgap against electron temperature for (SiO2)10, with the optimized geometry shown at several excitation levels. The gap falls from 9.3 eV to about 7 eV, and the network visibly opens.
02Charges move before the atoms do
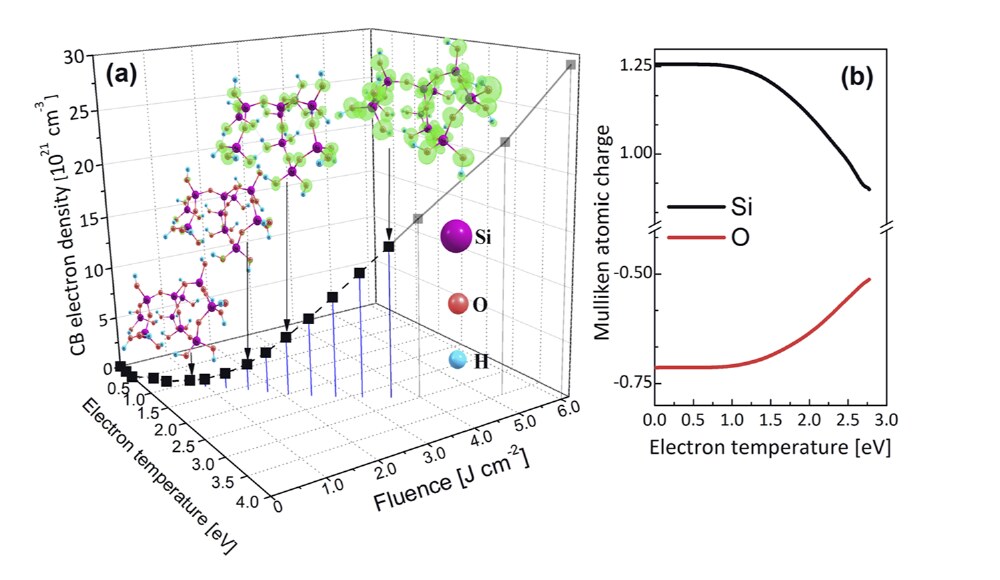
(a) Conduction-band electron density against electron temperature and laser fluence; the isosurfaces show where the excited charge sits at 1, 1.6 and 2.8 eV. (b) Mulliken charge of silicon and of oxygen against electron temperature.
Where does the excited charge go first? The spatial distribution of the fractional occupation answers directly. At low excitation the hot electrons localize around oxygen atoms belonging to OH groups, then around bridging oxygens; only above about 2.5 eV do the silicon electrons take part. The electron cloud around silicon stays largely unaffected until late.
The consequence is measurable on the charges. Silicon goes from +1.26 to +0.90 and oxygen from −0.71 to −0.51 at 2.8 eV: roughly half of the electrostatic attraction holding the Si–O bond together is simply removed. The Si–O bond is polar-covalent, and it is the ionic fraction that is being dismantled. About 4% of the valence electrons, some 1.4×1022 cm−3, are enough to do it.
This is what makes the damage threshold of a dielectric a bonding problem rather than a heating problem. The lattice has not yet had time to warm; the solid is destabilized because its bonds have been electronically emptied.
03Following it in time
A fixed electron temperature says what the excited state is; it does not say how fast the structure follows. Running ab initio molecular dynamics on the same cluster, with the electrons kept at an elevated temperature, gives the timing.

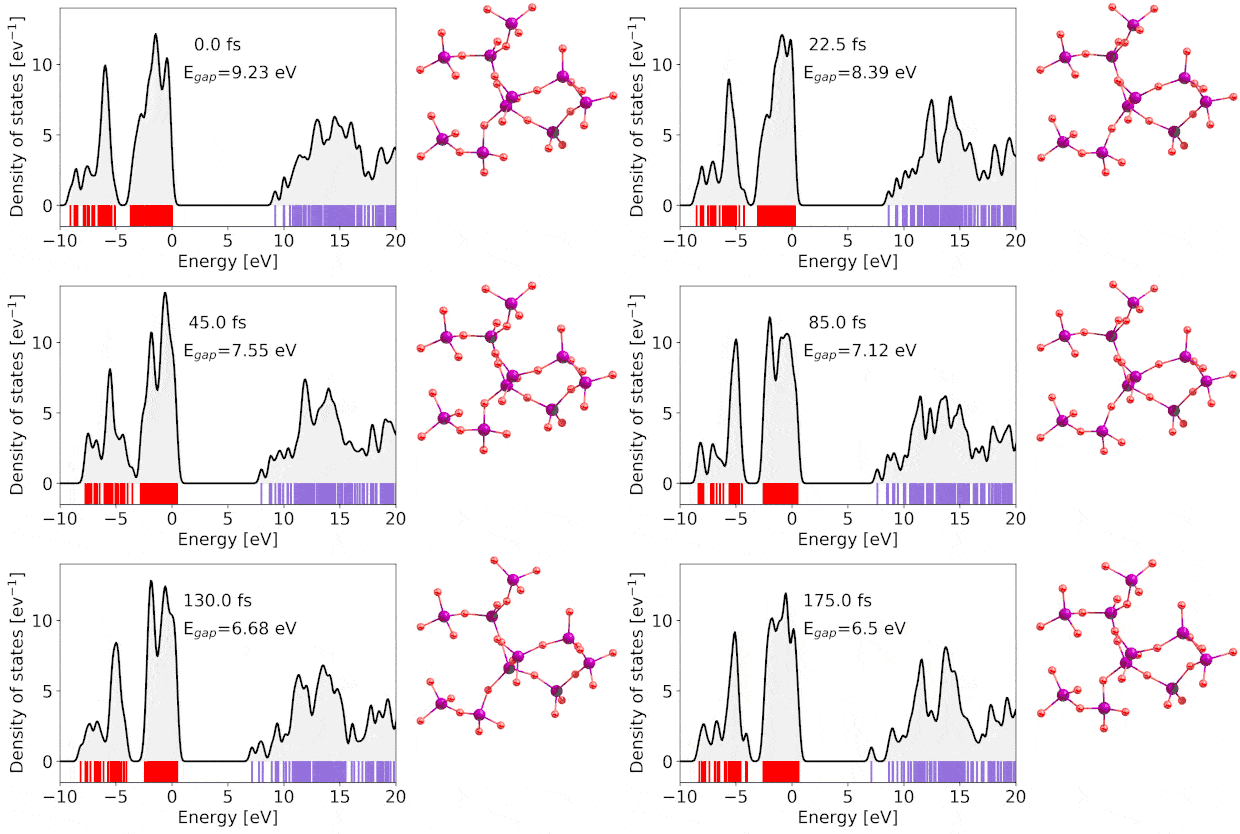
The expansion is essentially complete within 200 fs, which is far shorter than any electron–phonon equilibration time. It is not thermal: the lattice temperature actually peaks near 300 K at 25 fs and then falls back as the system reaches equilibrium between electrons and atoms. What drives the motion is the increase in electronic pressure and the redistribution of charge between oxygen and silicon, a nonthermal rearrangement, on the timescale of the pulse itself.
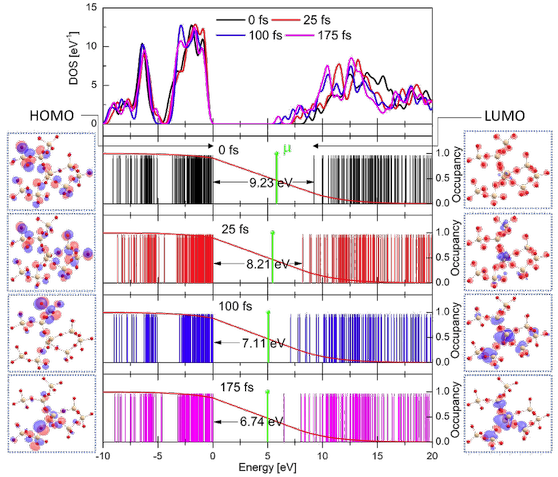
Electron density of states of the cluster at 0, 25, 100 and 175 fs (top), with the instantaneous occupancy and gap value at each time, 9.23, 8.21, 7.11 and 6.74 eV, and the frontier orbitals, highest occupied and lowest unoccupied, drawn as isosurfaces on either side.
The frontier orbitals make the mechanism visible. At time zero the highest occupied orbital is strongly localized on non-bonding oxygen 2p states; by 100 fs, as the cluster has expanded by more than 10%, a contribution from specific oxygen atoms on one side of the cluster appears that was not there before. The lowest unoccupied orbital, delocalized over the entire cluster at first, becomes concentrated on a few tetrahedra by 175 fs.
Reading those orbitals is therefore a way of predicting where the network will fail: further expansion or stronger excitation will break bonds along the tetrahedron the frontier orbitals have singled out. Order and disorder are being decided at the level of individual bonds, well before anything macroscopic happens.
The bandgap itself has to be treated with some care in this regime. Plain density functional theory is not reliable for the gap of an excited insulator: it even predicts a slight increase at low excitation, which is incorrect. Adding the many-body correction of the GW approximation restores the physical behaviour: from 9.1 eV in the ground state down to 5.6 eV at an electron temperature of 1.8 eV. That difference matters far beyond bookkeeping: the photo-excitation rate computed from Keldysh theory rises by more than a factor of fifty when the gap falls from 9 to 5 eV over the first 50 fs. The material becomes dramatically easier to ionize as a direct consequence of having been ionized.
A complementary, fully time-dependent picture confirms this diagnosis without needing an electron temperature at all. Real-time TDDFT, solving the time-dependent Kohn–Sham equation under an explicit vector potential with the SALMON code, follows the same excitation directly in time, orbital by orbital, from the untouched ground state onward.
The vector potential A(t) encodes the laser field itself, and V(r,t) carries the ionic, Hartree and exchange–correlation potential, recalculated at every time step. Nothing here is thermal: the electrons are propagated in real time, cycle by cycle of the pulse, and whatever heating or screening appears is a consequence of that dynamics rather than an assumption fed into it.

Real-time Kohn–Sham equation solved for each orbital ψi under the vector potential A(t) of the pulse.
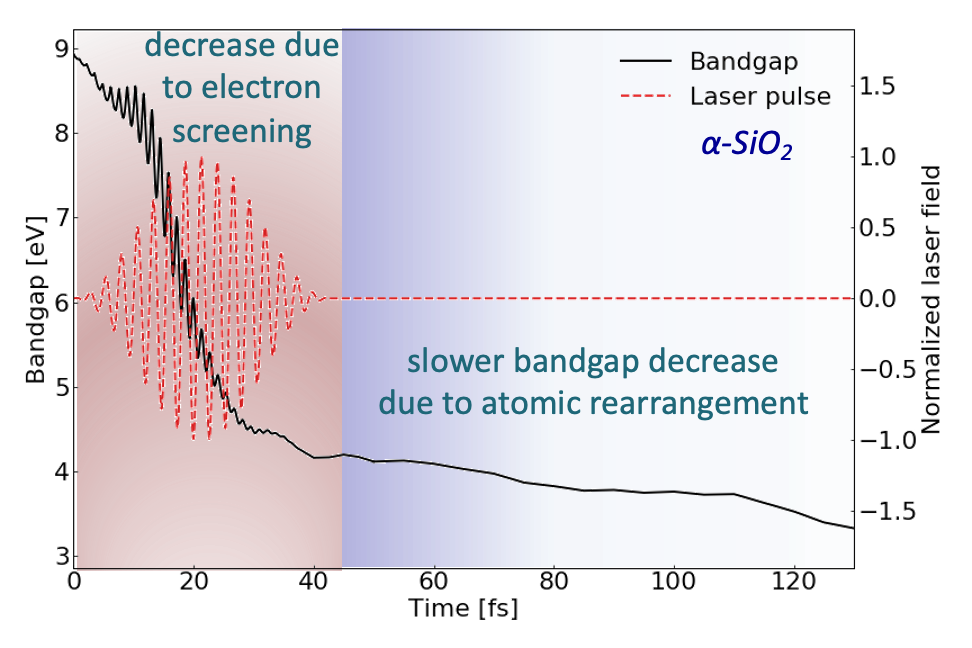
The same calculation gives the gap directly, and splits what looked like one collapse into two distinct regimes rather than a single decay. While the pulse is present, the gap tracks the growing electron screening: an overall drop overlaid with a faster ripple set by each optical cycle, the signature of dressed states following the instantaneous field rather than any lasting change of the ground state. Once the pulse has passed, quantum molecular dynamics takes over and adds a second, slower phase in which atomic rearrangement sharpens the closing of the gap well beyond what screening alone would produce.
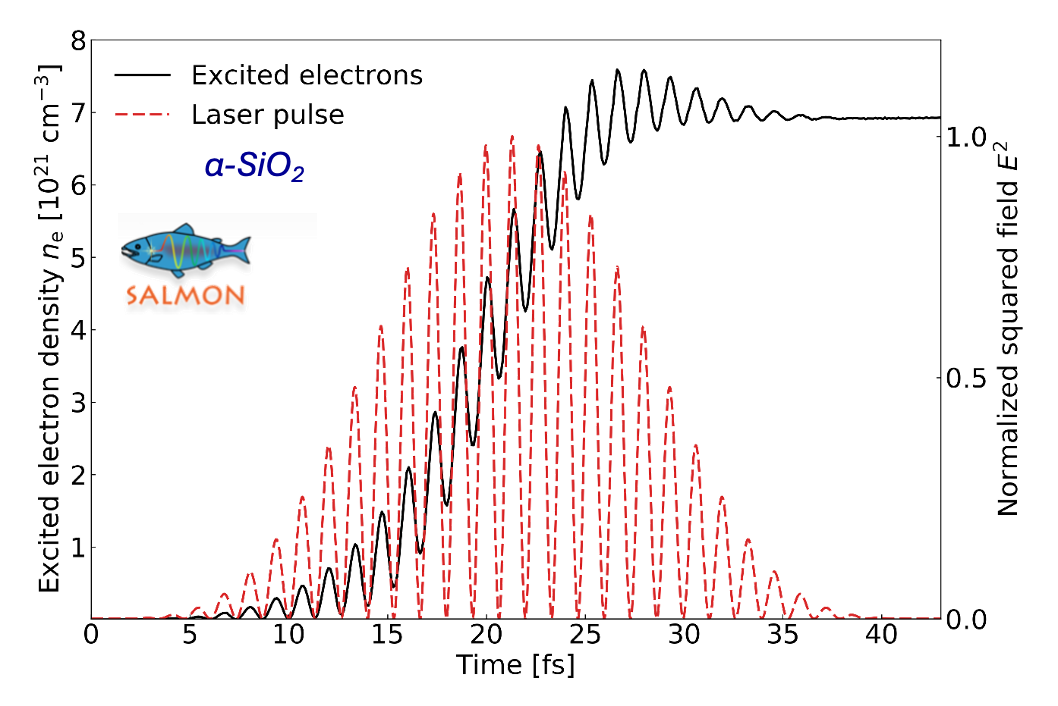
Excited electron density (solid) and normalized squared laser field (dashed) during a 15-fs pulse at 800 nm and 2.2 J/cm², computed with real-time TDDFT (SALMON). The density climbs in steps timed to each optical half-cycle and saturates once the pulse has passed, closely matching the finite-temperature picture above. Kachan et al., Eur. Phys. J. Spec. Top. 1–5 (2023).
04What a two-temperature model needs, and cannot invent
The models further down the chain, the pore collapse and the crystallization of theme 03, are run by a two-temperature molecular dynamics. That scheme asks for five quantities as functions of the excitation: how many electrons are actually promoted, how much energy that gas stores, how much pressure it exerts, how heavy the carriers are, and how fast they hand the energy back to the lattice. In a metal these are tabulated. In a dielectric none of them exists at equilibrium, because at equilibrium the conduction band is empty. They have to be computed.
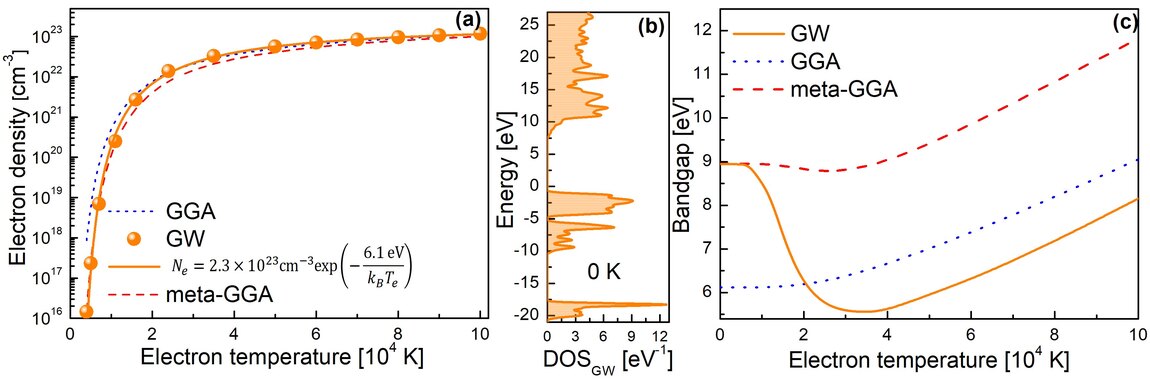
The first quantity is the carrier density itself. It is what the electromagnetic calculation delivers and what every other curve is plotted against, and it is where the choice of functional shows: a plain gradient approximation underestimates the gap and therefore overestimates how many carriers a given temperature produces. The GW correction is not a refinement here, it fixes the abscissa of everything else.
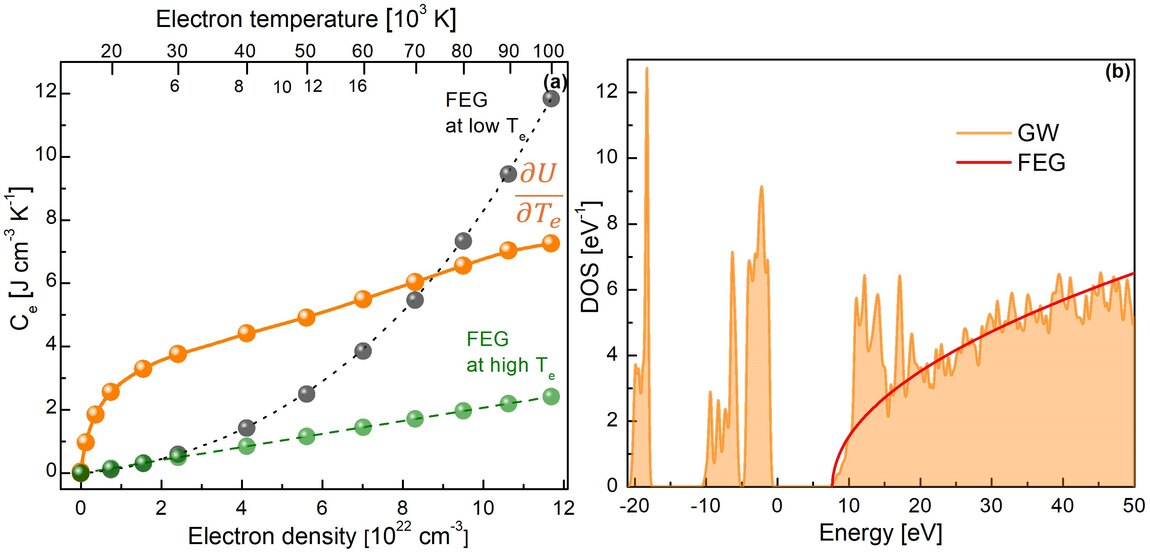
The heat capacity sets how much energy the electron gas absorbs before returning it, and therefore how hot the lattice eventually becomes. The free-electron approximation, which is what a standard two-temperature code assumes, brackets the computed values but does not reproduce them: the structured density of states of silica means the capacity depends on where in energy the carriers sit, not only on how many there are.
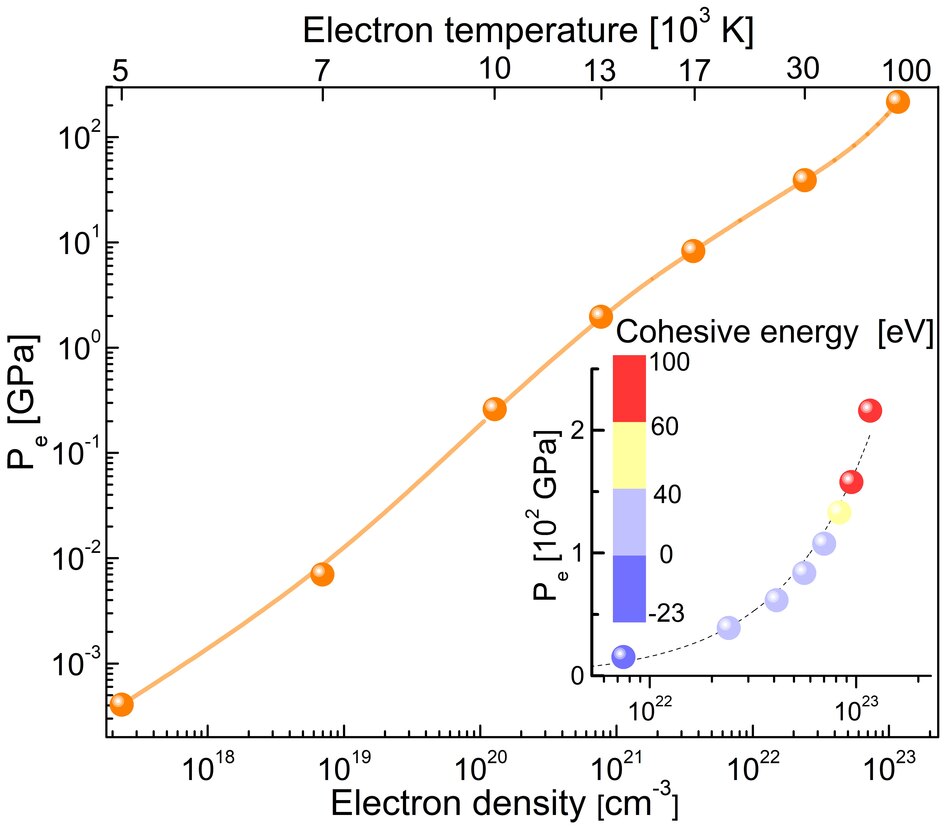
The electronic pressure is the quantity that makes the next theme possible. It builds up while the ions are still cold, reaches tens of gigapascals at the densities produced around a pore, and it is what drives the collapse and the transient high-pressure state in which a high-pressure crystal can nucleate. The inset shows the counterpart: as the pressure rises the cohesive energy falls, so the same excitation that pushes also weakens.
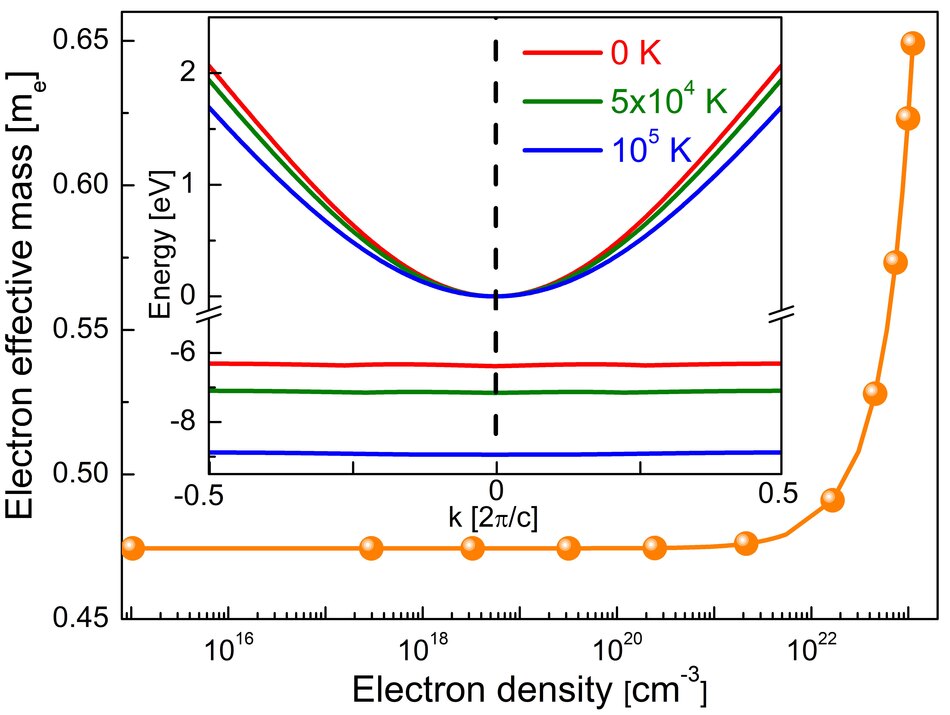
The effective mass stays almost constant over four decades of density and then rises steeply above 1022 cm-3, because the conduction band flattens under strong excitation. Since the mass enters the optical response and the transport, this is the point beyond which a Drude description with fixed parameters stops meaning anything.
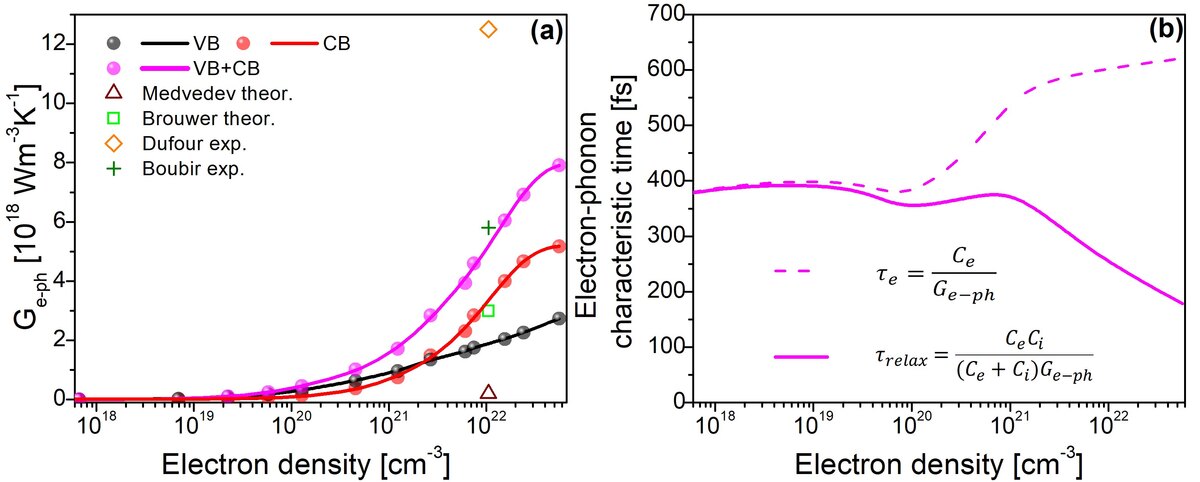
The coupling grows with the carrier density and the relaxation time drops correspondingly, from several hundred femtoseconds at low excitation towards about a hundred at the densities reached near a pore. That number decides whether the energy is still in the electrons when the material starts to move, and therefore whether the response is driven electronically or thermally.
On the phonon side, the coupling in quartz is carried by a few optical modes above 1000 cm-1 rather than spread over the spectrum, and the phonon density of states softens as the electron temperature rises. The absence of imaginary frequencies at moderate excitation is a direct statement about mechanical stability, and a way to anticipate where a transition will open.
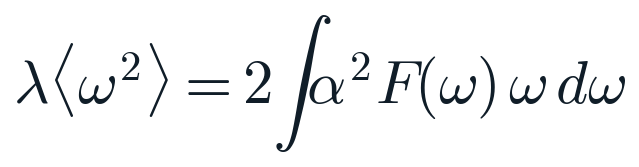
Second moment of the Eliashberg function, which sets the strength of the exchange between electrons and lattice.
05Where this hands over
Five curves, all functions of the excitation, all absent from any table. Feed them to a two-temperature molecular dynamics and the collapse of a nanopore becomes a calculation; assume them constant and it becomes a fit. That handover is the subject of the next theme, where the same silica is taken through a phase transition and quenched into a high-pressure crystal.
Read alongside the other themes, this is the first rung of the ladder applied to a dielectric rather than a metal. The order parameter is the band occupation and the charge on the bond, the excitation destroys it, and what matters downstream is not that it was destroyed but by how much, since every coefficient the rest of the chain needs is a function of that number.
Key publications
- Unraveling the electronic properties in SiO2 under ultrafast laser irradiationA. Tsaturyan, E. Kachan, R. Stoian, J.-P. Colombier, npj Computational Materials 10, 200 (2024). doi.org/10.1038/s41524-024-01350-2
- Excited-state dynamics and optical properties of silica under ultrafast laser irradiationA. A. Tsaturyan, E. Kachan, R. Stoian, J.-P. Colombier, Advanced Physics Research 2400106 (2024). doi.org/10.1002/apxr.202400106
- Ultrafast bandgap narrowing and cohesion loss of photoexcited fused silicaA. Tsaturyan, E. Kachan, R. Stoian, J.-P. Colombier, Journal of Chemical Physics 156, 224301 (2022). doi.org/10.1063/5.0096530
- First-principles study of ultrafast bandgap dynamics in laser-excited α-quartzE. Kachan, A. Tsaturyan, R. Stoian, J.-P. Colombier, The European Physical Journal Special Topics, 1-5 (2023). doi.org/10.1140/epjs/s11734-022-00747-8

