Theme 06
Laser self-organization of the relief: from a hydrodynamic instability to a selected pattern
Between the excited electron and the frozen nanostructure there is a liquid. It lives for about a hundred picoseconds per laser pulse, and during that window the surface is no longer a solid but a thin film driven by the map of its own absorbed energy. Out of it comes a whole family of nanoscale morphologies: peaks, cavities, stripes, labyrinths, crosshatch, on a homogeneous metal, with no mask and no template. The claim of this theme is that they are all the same instability seen at different points of one phase diagram, and that two numbers are enough to say which one will appear.
Experiments, nonlinear hydrodynamics and physics-guided learning, with Anthony Nakhoul, Sylvain Georges, Quentin Fornasiero, Eduardo Brandao, Anton Rudenko, Emeric Gandon, Nicolas Faure, Claire Maurice, Florence Garrelie and Florent Pigeon.
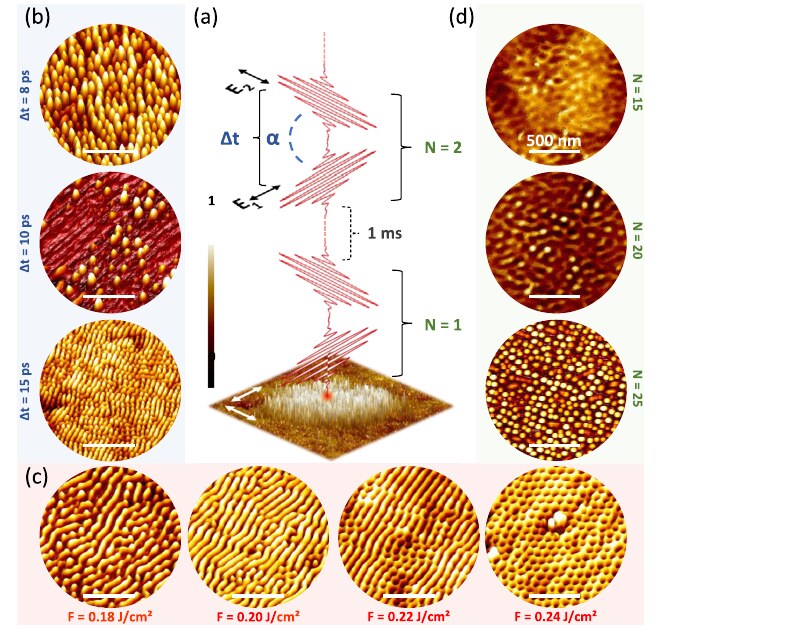
Two control knobs, one material, and a family of distinct symmetries: that is the whole experimental situation this theme has to explain.
01A zoo of nanostructures on a plain metal surface
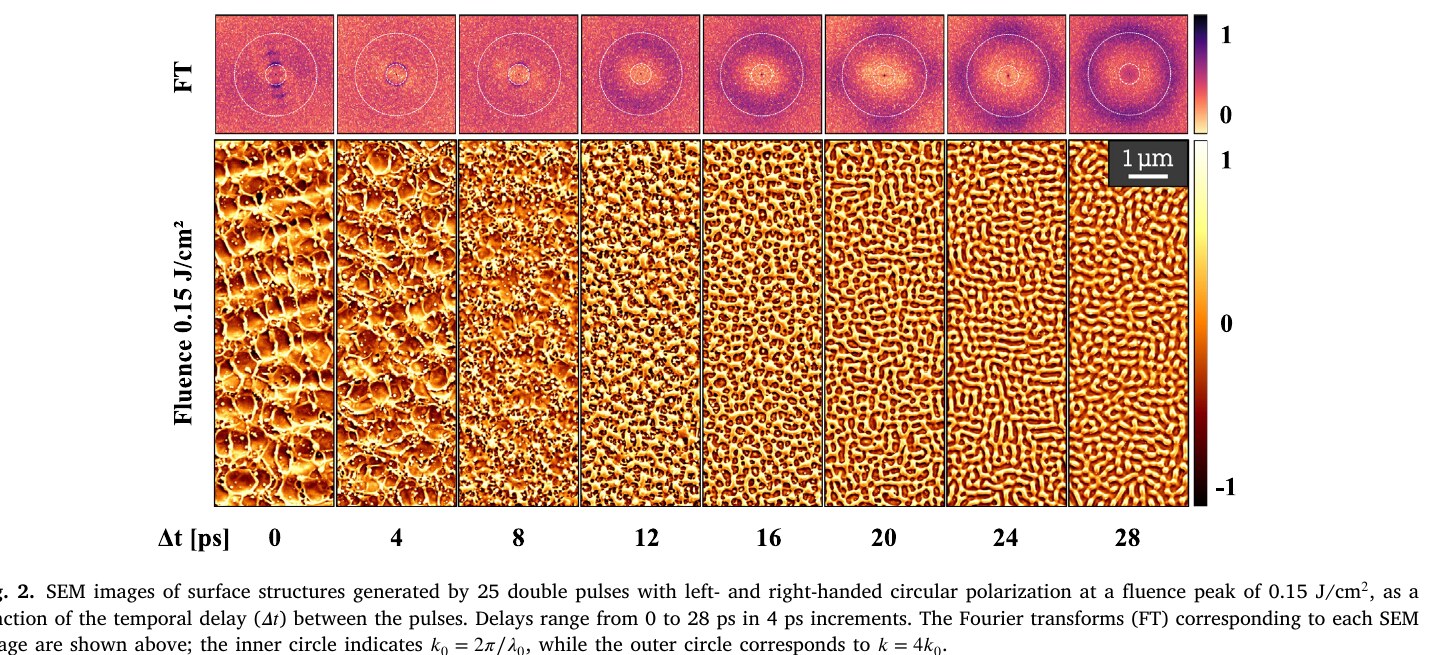
Irradiate a nickel single crystal with a sequence of double femtosecond pulses, vary only two things (the fluence and the delay between the two pulses) and the surface produces a catalogue of distinct morphologies. Not variants of one shape: genuinely different symmetries, each reproducible, each occupying its own domain of the parameter plane.
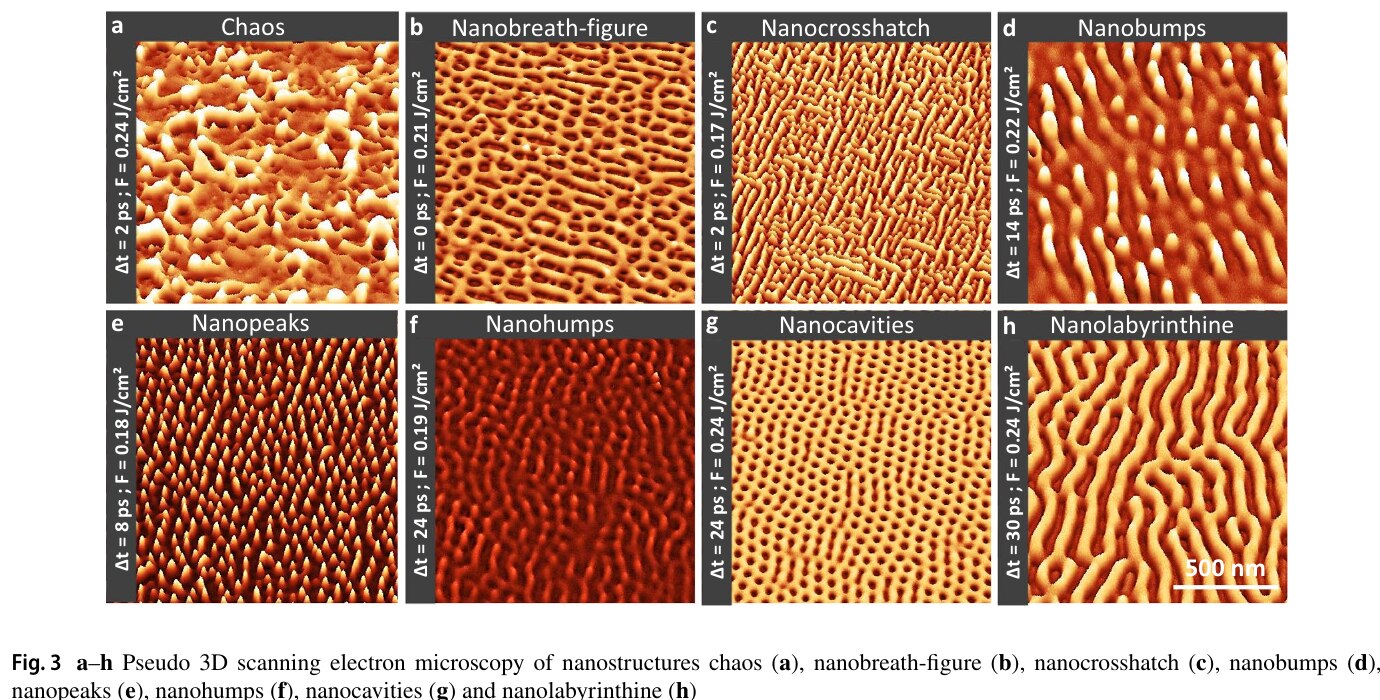
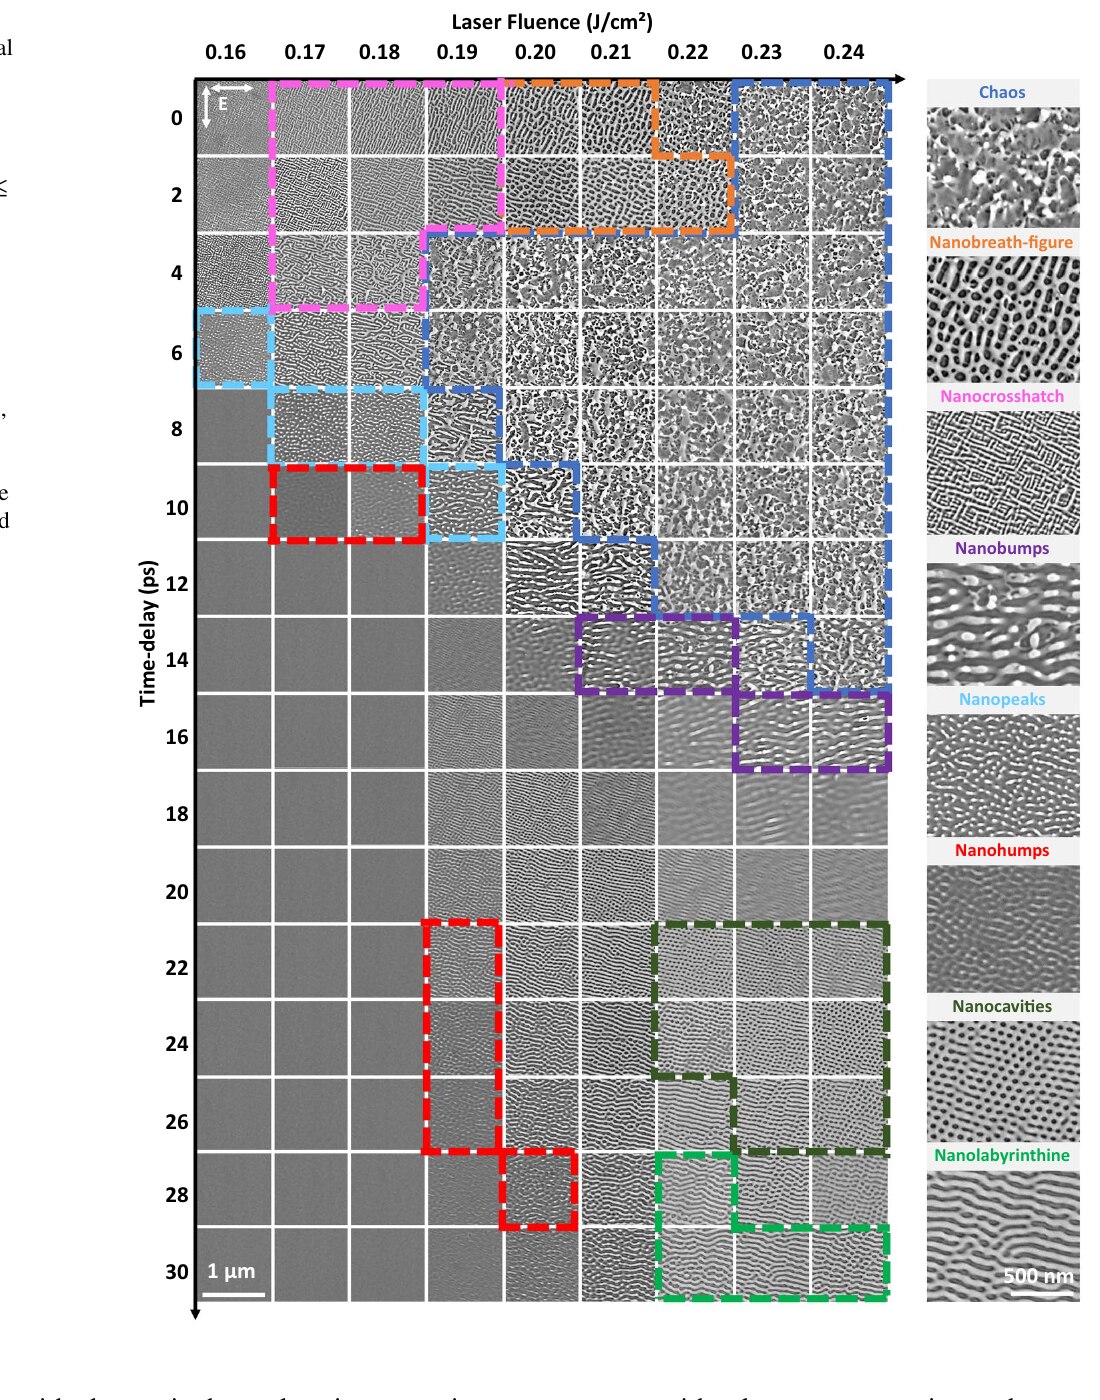
The same surface, mapped. Scanning electron microscopy of Ni(001) after 25 double pulses, for fluences from 0.16 to 0.24 J/cm2 and delays from 0 to 30 ps. The coloured frames mark the domains of each morphology; the white arrow gives the polarization.
The map is the important object here. Every square is a real irradiation, and the domains do not interleave randomly: they form connected regions with boundaries that a single control parameter cannot explain. Something is selecting a symmetry, and it is doing so as a function of two quantities that the experimentalist sets independently.
Note also what the map does not show. There is no imprint of the beam profile, no memory of the polarization direction in most of the domains, and no periodicity inherited from an interference pattern. The scale, a hundred to two hundred nanometres, is far below the wavelength. The order is made by the surface, not delivered to it.
02Watching it build, pulse by pulse
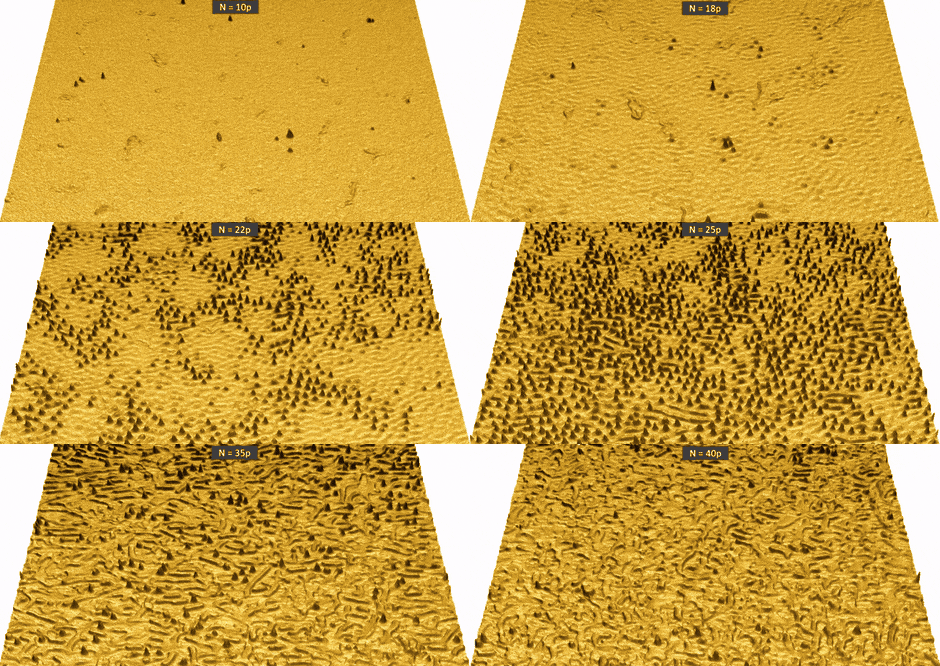
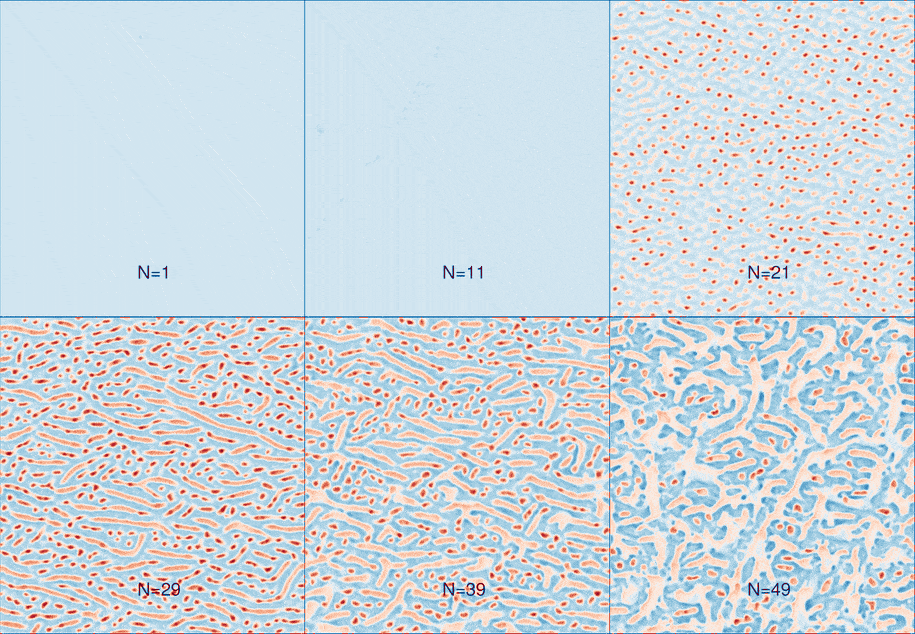
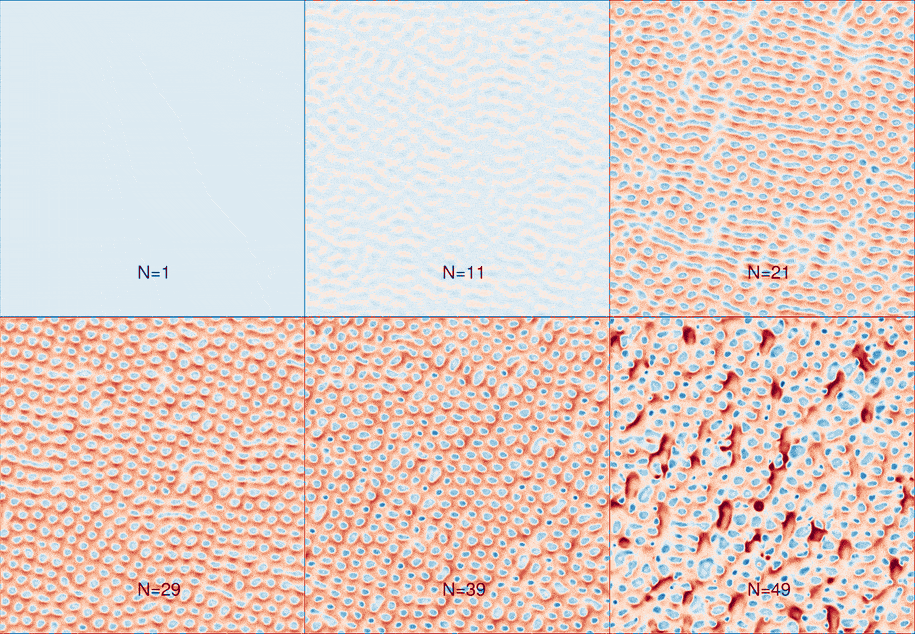
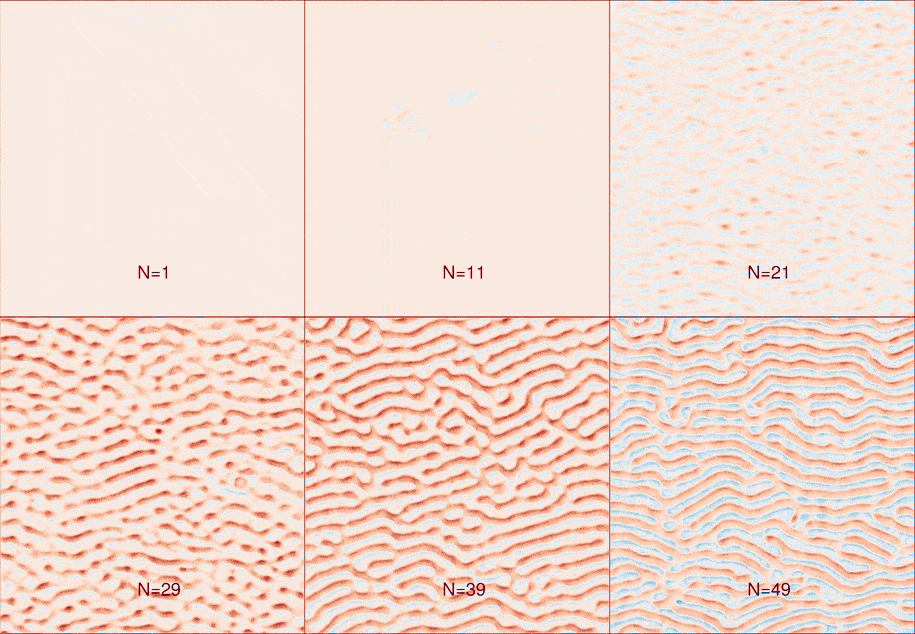
A static micrograph after N pulses hides the essential fact: the pattern is not printed, it grows. Imaging the same spot after every pulse turns the experiment into a film, and the film is what a model has to reproduce.
Nanopeaks
F = 0.18 J/cm2, Δt = 8 ps
Nanocavities
F = 0.26 J/cm2, Δt = 28 ps
Nanostripes
F = 0.25 J/cm2, Δt = 36 ps
Nanocrosshatch
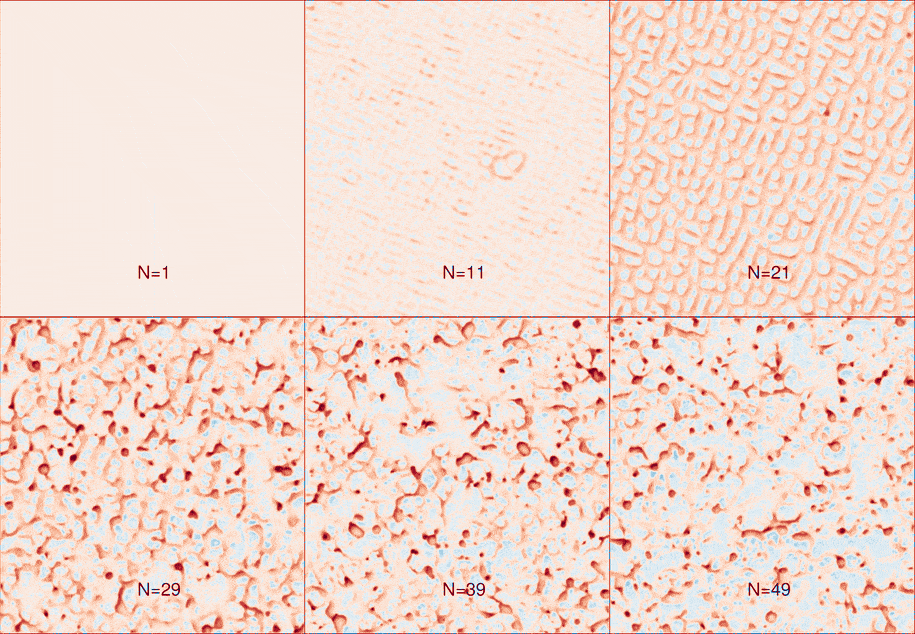
F = 0.21 J/cm2, Δt = 2 ps
Four regimes on Ni surfaces, each followed from the first pulse to N = 50. These are imaged topographies by scanning electron microscopy of the same area after every pulse, with the height normalized and the colour scale remapped for legibility. Four irradiation conditions, four different symmetries, one material.
Read across the four films and a common structure appears. The period is established early, within the first handful of pulses, and barely moves afterwards. The symmetry is settled later, and it is what differs between the four. And in every case the degree of order is not monotonic: it improves, reaches a best, then degrades. Any model of this process has to produce those three behaviours together.
03Coupling light to the flow
The physical chain is short, and each link is a different equation. Maxwell’s equations, solved on the actual topography, give the map of absorbed energy. A two-temperature description with phase change converts that map into a molten depth of a few tens of nanometres. The Navier–Stokes equations then move the liquid, with a thermocapillary boundary condition at the free surface: where the liquid is hotter, the surface tension is lower, and the film is pulled away from it.
A bump stores less heat per unit depth, is therefore cooler, has a higher surface tension, and draws liquid towards itself. Capillarity resists. Out of that competition comes a wavelength, and the fact that it is set by the melt depth rather than by the light is why the period lands at a hundred nanometres instead of at the optical wavelength.
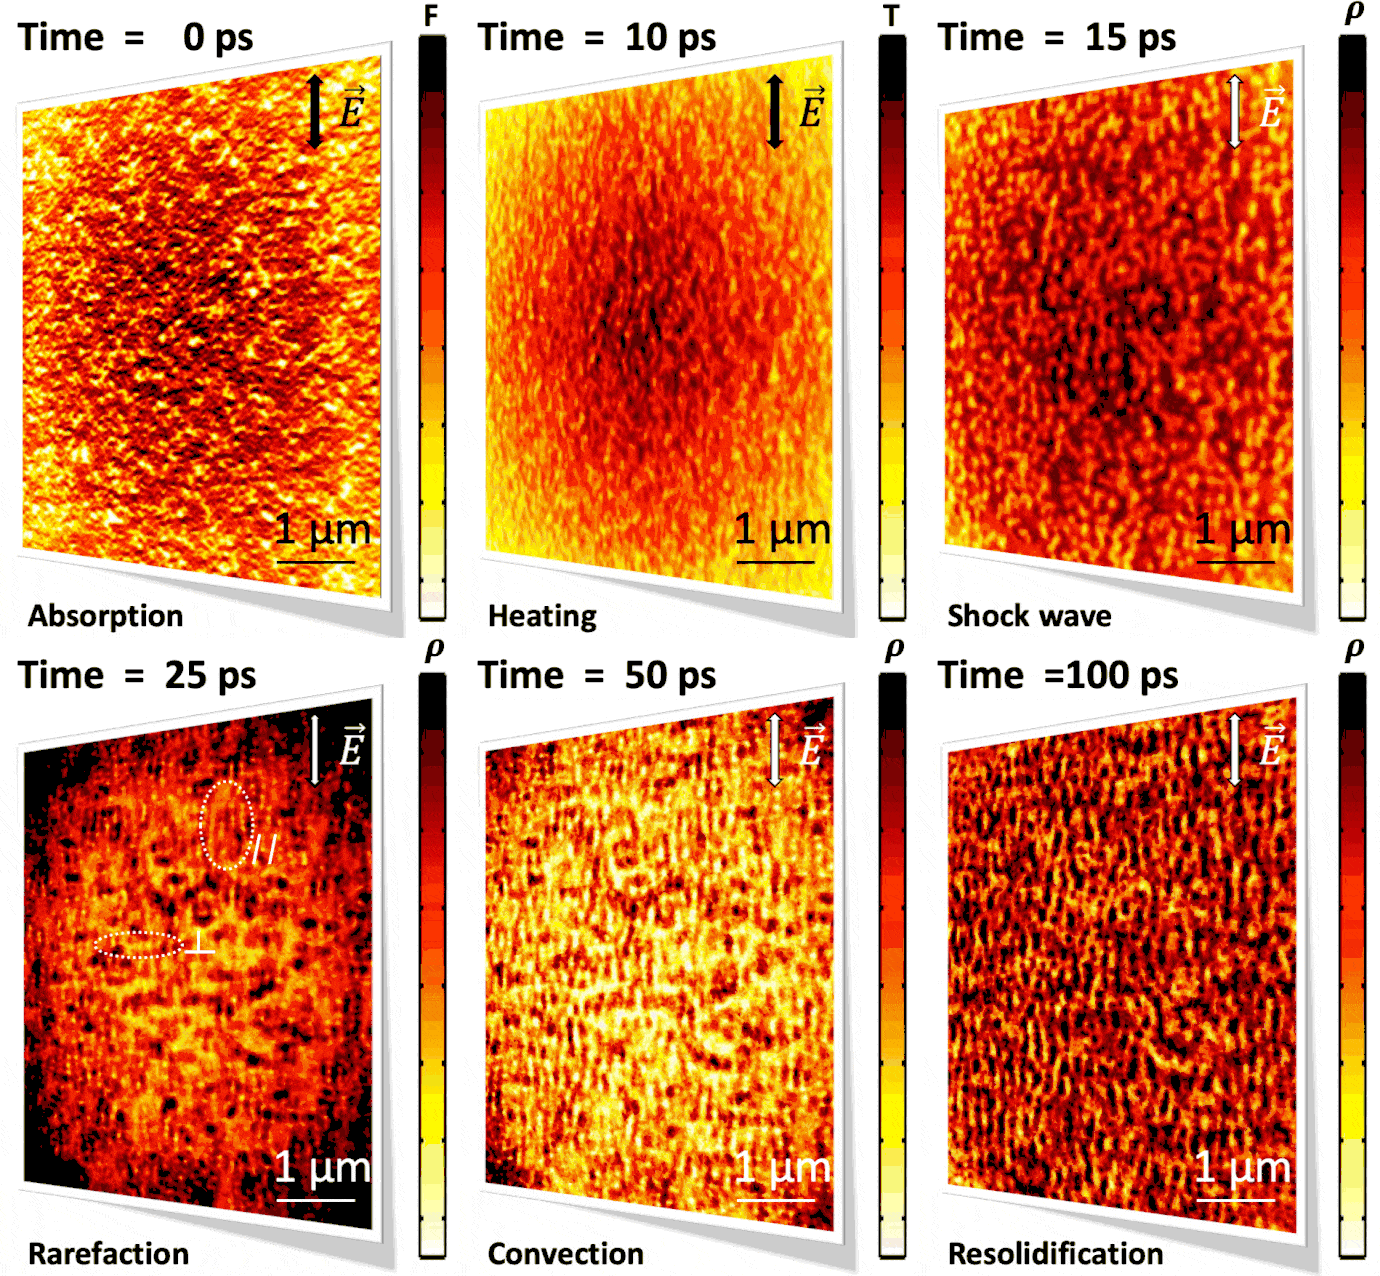
Simulation on a statistically rough surface: the absorbed energy map at the arrival of the pulse, and the hydrodynamic evolution of the molten layer that follows it.
Fully resolved simulations of this kind reproduce a single pulse convincingly. They cannot be run fifty times in a row over a domain large enough to contain a pattern, and, being deterministic, they contain nothing for the instability to amplify. Both problems point the same way: towards a reduced model.
04One generic equation
Integrating the flow across the thin molten layer, keeping the thermocapillary driving and the capillary restoring stress, and expanding near the onset of the instability, the height of the surface obeys the Swift–Hohenberg equation: the canonical model of pattern formation, written in 1977 for convective instabilities and used ever since for Rayleigh–Bénard convection, reaction–diffusion systems and thin films. It is not imported here by analogy: it comes out of the hydrodynamics, and its coefficients are explicit combinations of the surface tension, the viscosity, the thermocapillary coefficient, the melt depth and the absorbed energy profile.

Everything then sits in two numbers. The first, ε, is the distance to threshold: how far the system is from the point where the surface stops being flat. The second, γ, is a symmetry parameter: it measures the strength of the quadratic coupling, the only term that can select a direction, because it feeds energy back onto the critical circle solely through closed triads of wavevectors at 120°.
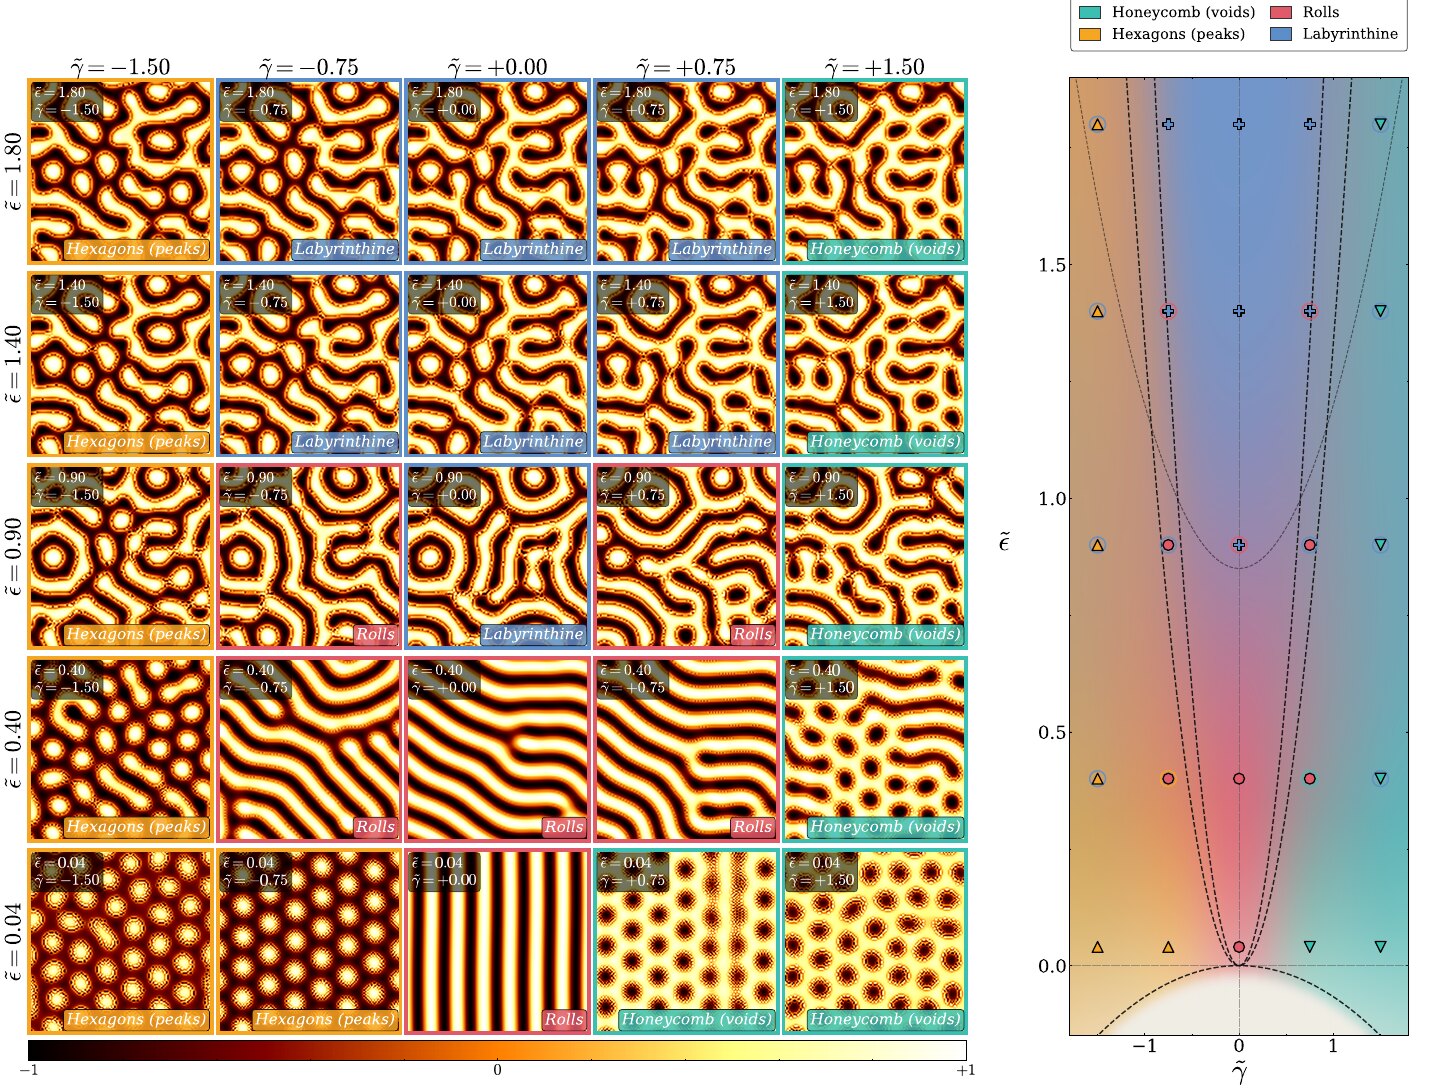
The wavelength is fixed early, by the linear filter, and is common to every morphology. The symmetry is negotiated later, by the nonlinearity. That is why the period is robust across the experimental conditions while the symmetry switches readily with fluence and delay.
Put the two diagrams side by side (the experimental map in fluence and delay, the numerical one in ε and γ) and the same objects appear in the same arrangement: a flat region, a broad hexagonal domain, a band where two symmetries coexist, and a labyrinthine regime beyond. The correspondence is the result. What remains is to make it quantitative.
05Reading the laser parameters as model parameters
Showing that the equation can produce the right shapes is one thing; knowing which pair of parameters corresponds to a given laser setting is another. The map from (fluence, delay) to (ε, γ) cannot be written down analytically, and the experiment gives only isolated micrographs, not time series. So we inverted it by learning.
The procedure is the one published with Eduardo Brandao in Physical Review Letters. A large library of Swift–Hohenberg solutions is generated across the parameter plane. A deep convolutional network is then trained to recognize, from an image alone, which dominant modes have stabilized, that is, which bifurcation the surface has settled into. Applied to the experimental micrographs, this classifier attaches to every measured surface the model parameters that reproduce it, and the fluence–delay plane can be redrawn in the language of the theory.
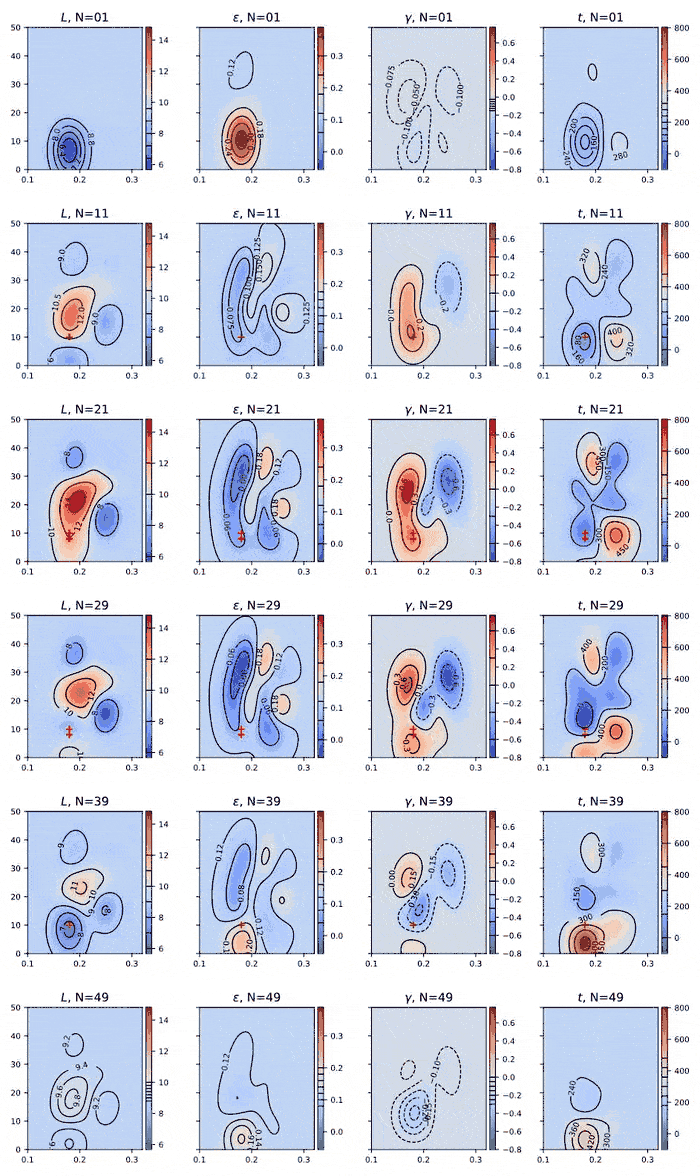
Two things are worth noting. First, the inference is physics-guided: what the network learns is not a black-box classifier of images but the position of a surface in a known bifurcation diagram, so its output has a meaning outside the training set. Second, the map runs both ways: given a target morphology, the diagram returns the fluence and the delay that produce it, which is the practical form the question takes in laser processing.
The complexity of the pattern itself can be measured the same way, and it turns out to increase and then saturate with pulse number: the surface first learns a symmetry, then loses it again. That observation is developed in Photonic learning.
06Order is self-limiting
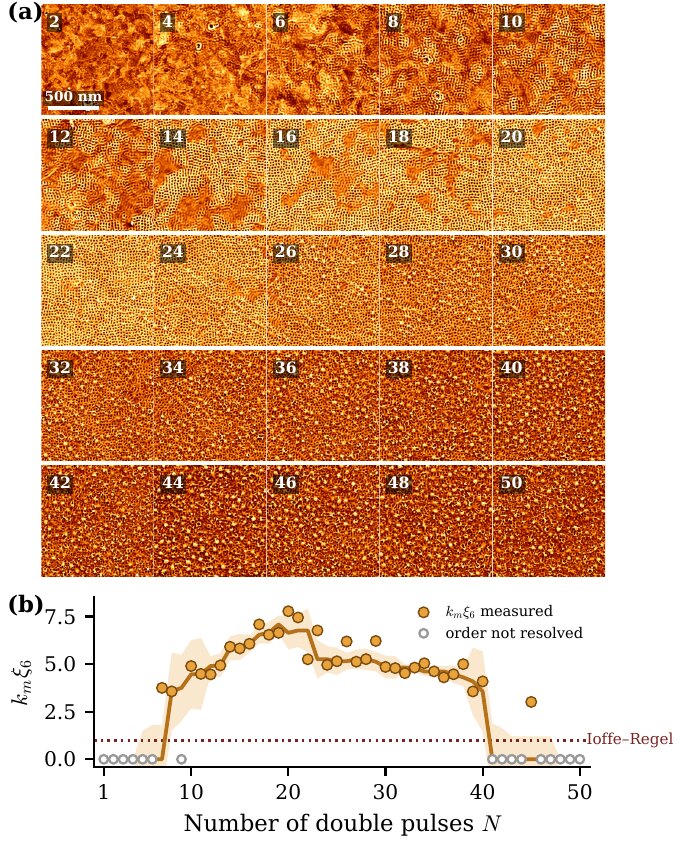
(a) Twenty-five of fifty micrographs of the same spot, one every other pulse. (b) The six-fold orientational coherence length measured on the cavity positions: it appears around N = 6, peaks near N = 20, and has collapsed by N = 41–50.
On a freshly polished surface the critical mode is spatially extended, and the picture above applies without correction. But each pulse deposits corrugation, and the frozen topography plays two roles at once: it is the product of the instability driven by the pulses before it, and it is the disorder seen by the pulse after it. Beyond a certain accumulated roughness, the pattern scatters the very modes that build it, and long-range orientational order is lost while the local periodicity survives.
The effect is directly measurable. Extracting the orientational coherence length pulse by pulse from the micrographs gives a curve that rises, peaks and falls: there is a finite window (here roughly between six and forty pulses) in which a well-ordered surface exists at all. This is the non-monotonic behaviour visible in the films of section 02, now with a number attached to it.
07Where this scale sits in the chain
This theme is the hydrodynamic link of a longer chain. The optical coefficients that set the skin depth come from first-principles calculations of the excited solid; the melt depth and the recoil come from two-temperature molecular dynamics; the absorbed energy map comes from Maxwell’s equations solved on the real relief. What this layer adds is the step where an ordered structure actually appears, and the step where it stops appearing.
It is also where the work becomes useful. The morphologies catalogued above are not curiosities: a lattice of nanocavities, a forest of nanopeaks and a labyrinth of ligaments have different wetting, different optical response and different biological behaviour. Being able to place an irradiation condition on a phase diagram is what turns that into a specification. That is the subject of Functionalized surfaces.
Papers behind this theme
E. Brandao, A. Nakhoul, S. Duffner, R. Emonet, F. Garrelie, A. Habrard, F. Jacquenet, F. Pigeon, M. Sebban and J.-P. Colombier, Learning complexity to guide light-induced self-organized nanopatterns, Phys. Rev. Lett. 130, 226201 (2023). doi.org/10.1103/PhysRevLett.130.226201
A. Nakhoul, C. Maurice, N. Faure, F. Garrelie, F. Pigeon and J.-P. Colombier, Tailoring the surface morphology of Ni at the nanometric scale by ultrashort laser pulses, Applied Physics A 128, 933 (2022). doi.org/10.1007/s00339-022-06046-2
A. Nakhoul and J.-P. Colombier, Self-organized nanostructures on metal surfaces driven by ultrafast laser irradiation, Laser Photonics Rev. 18, 2300991 (2024). doi.org/10.1002/lpor.202300991
A. Rudenko, A. Abou-Saleh, F. Pigeon, C. Mauclair, F. Garrelie, R. Stoian and J.-P. Colombier, High-frequency periodic patterns driven by non-radiative fields coupled with Marangoni convection instabilities, Acta Materialia 194, 93 (2020). doi.org/10.1016/j.actamat.2020.04.058
S. Georges, D. Iabbaden, A. Nakhoul, X. Sedao, Y. Di Maio and J.-P. Colombier, Isotropic 2D nano-patterning with temporally shaped dual circularly polarized ultrafast beams, Applied Surface Science, 167063 (2026). doi.org/10.1016/j.apsusc.2026.167063
J. Swift and P. C. Hohenberg, Hydrodynamic fluctuations at the convective instability, Phys. Rev. A 15, 319 (1977). doi.org/10.1103/PhysRevA.15.319
J.-P. Colombier, E. Brandao, E. Gandon and Q. Fornasiero, nonlinear hydrodynamic theory of ultrafast laser nanopatterning (2026).

